Smith 171.66, Guptill 12.60
Stats highlights from the second day of the Adelaide Test
Shiva Jayaraman
28-Nov-2015
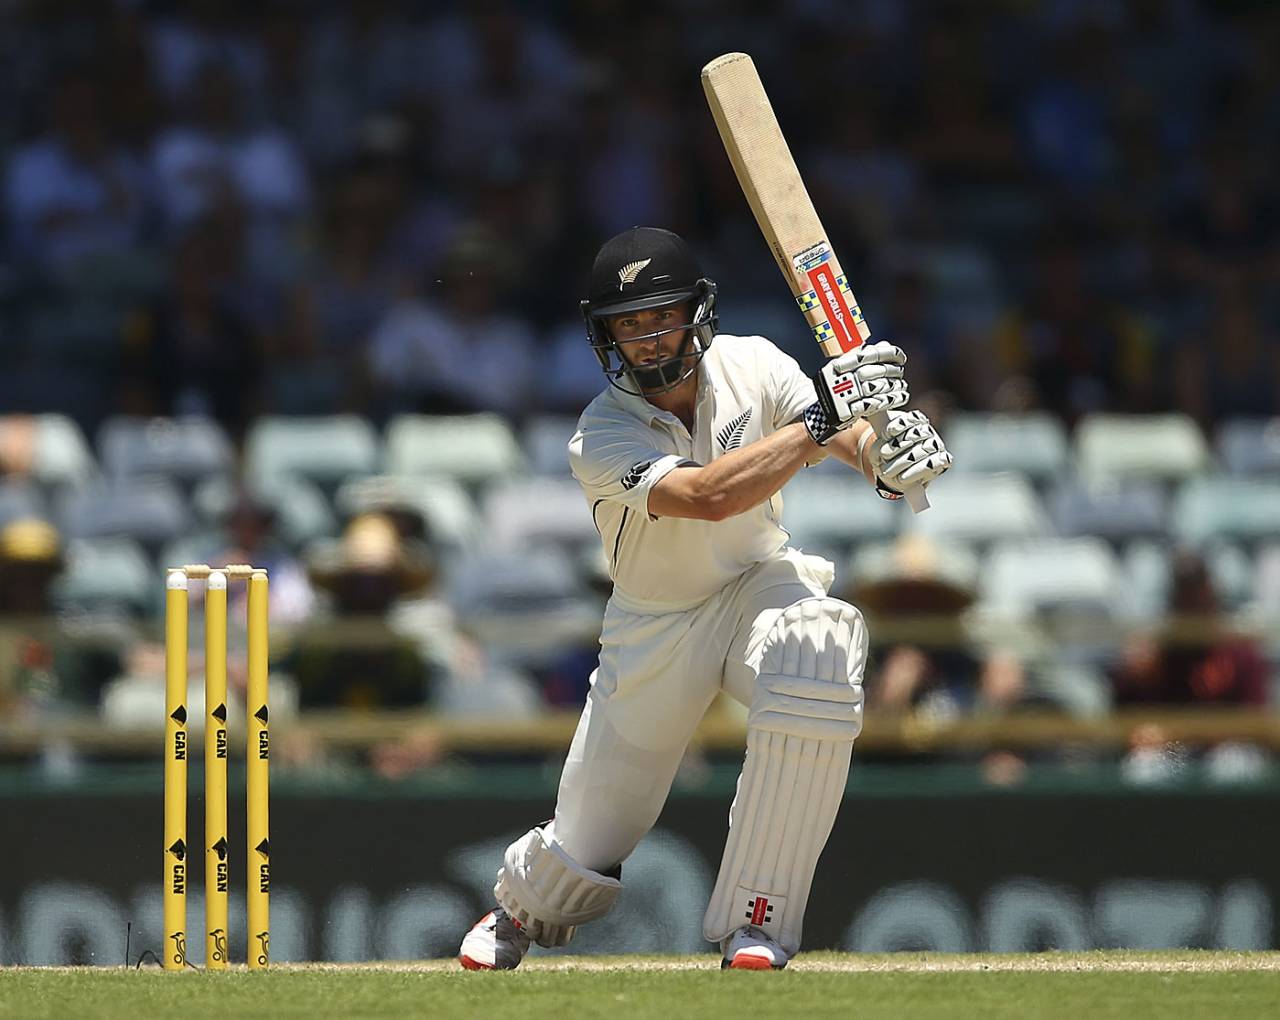
Kane Williamson has made 428 runs in this series - the first time an overseas batsman has made 400 or more runs from three or fewer matches in a series in Australia • Getty Images
171.66 Steven Smith's batting average in first-class matches at the Adelaide Oval. His fifty in this innings was his fifth consecutive fifty-plus score at this venue. He has made 515 runs including two hundreds and five fifties in just seven innings at the Adelaide Oval.
66 Runs scored by Peter Nevill in Australia's first innings - his highest Test score and his second fifty in nine innings. He had made 59 at Edgbaston in the Ashes earlier this year. Nevill has 263 Test runs at 29.22.
50 Wickets Josh Hazlewood has taken in 12 Tests including the six in this. Only two other bowlers - R Ashwin and Stuart Broad - have taken more wickets than him since his debut at the Gabba last year.
74 Runs added by the stand between Nevill and Nathan Lyon - equaling the most Australia have added for their ninth wicket in Tests against New Zealand. Adam Gilchrist and Michael Kasprowicz had also added 74 in the Auckland Test in 2004-05. This was also the highest ninth-wicket stand at the Adelaide Oval since Michael Hussey and Stuart MacGill's partnership of 93 against West Indies in 2005-06.
86 Runs Australia trailed New Zealand by when they lost their eighth wicket, a deficit which was wiped out by their ninth and tenth-wicket stands. This is the second highest runs scored by a team's last two wickets to take the first-innings lead after being eight down for fewer than 150 runs. The only instance when a team has added more runs, came at Trent Bridge in the 2013 Ashes when Phillip Hughes combined with Ashton Agar and James Pattinson to score the 99 runs that were required to draw level with England's total of 215 in their first innings.
426 Runs scored by both teams in the first innings of this Test - the fifth lowest first-innings aggregate in any Test at the Adelaide Oval. The last time fewer than 426 runs were scored was in 1992 when the teams totaled 370 runs in the first innings. The lowest first-innings aggregate at this venue came in 1951-52 when only 187 runs were scored in the first innings.
25 Wickets that have fallen in this Test so far - the second most in the first two days of a Test at the Adelaide Oval. As many as 30 wickets had fallen in the first two days of the Test between Australia and West Indies in 1950-51. There are only ten other occasions when 25 or more wickets have fallen in the first two days in Australia. The previous instance had also come between these two teams, at the Gabba in 2008-09, when 26 wickets fell in two days.
0 Number of instances when an overseas batsman had made 400 or more runs in a Test series in Australia from three or fewer matches. Kane Williamson became the first batsman to do so having made 428 runs at 85.60 in this series. Williamson's tally is also the most by any New Zealand batsman in any series against Australia. Ross Taylor also completed 400 runs before being dismissed by Hazlewood in this second innings.
1976 The last time before this that as many as 13 wickets fell on the second day of a Test at the Adelaide Oval, which happened in a match between Australia and West Indies. Only once have more wickets fallen on the second day of a Test at this venue: 14, in the Ashes Test way back in 1894-95.
62 Runs scored by Australia in the first session on the second day - the fewest they have scored in a session for the loss of six or more wickets in a home Test since the Boxing Day Test of the Ashes 2010-11. In that match, they had lost six wickets for just 40 runs in the second session of the first day. This is the lowest they have averaged when they have lost five or more wickets in one session of a Test in Australia since 2010.
12.60 Martin Guptill's average as an opener in Tests against Australia - the second worst for any opener to have played at least ten innings against an opposition. Guptill made scores of 1 and 17 in this Test. Only South Africa's William Shalders had a worse average against any team: he made 159 runs from 13 innings at an average of 12.23 against England. Guptill's 82 runs in this series are the fifth lowest by a New Zealand opener to have played at least six innings in any series.
Shiva Jayaraman is a senior sub-editor (stats) at ESPNcricinfo.com